Darling Downs Piggery
Energy Savings: 48% | Cost Savings: $57,460 | CO2 Savings: 196 tCO2-e | Project Status: Proposed
Industry:
Pork
Location:
Darling Downs
Pump Type:
Not applicable
Irrigation Type:
Not applicable
Technology:
Heating, Lighting, Biogas, Power Factor Correction, Solar Power and Renewables
The evaluation of a Darling Downs Piggery involved a review and analysis of the existing business operations and its current energy consumption.
The audit found extensive energy efficiency opportunities available through low-cost measures, as well as some more significant upgrades.
The site houses over 9,000 pigs over the full life cycle and operates all year long.
Electricity powers most of the equipment on site with only a small amount of diesel being used to heat the Weaner sheds. Peak demand is relatively constant throughout the year reaching approximately 100 kVA per month.
Energy Use Breakdown
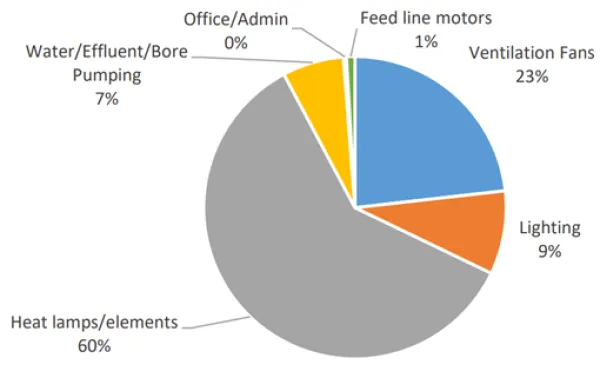
The figure below shows a breakdown of the proportion of electricity end use across the site. Heating equipment (heating elements, infrared lamps, and wall heaters) is the main consumer of electricity, accounting for approximately 60% of usage, while ventilation fans are the second largest consumer of electricity at the piggery.

Energy Efficiency Opportunities
A number of energy efficiency opportunities were identified:
Ventilation Fan maintenance.
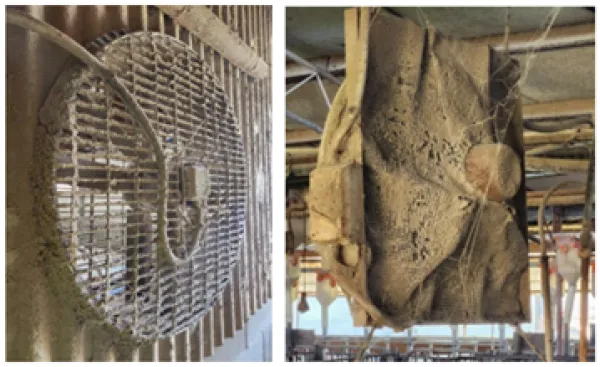
The site had a lot of dusty ventilation fans. The auditor estimated that airflow would be reduced by 20 – 40% as a result of dust build-up on the fan blades and guards.
As a result, the fans may not achieve the optimum cooling environment for the animals and also that less fans may be required to achieve the same level of comfort.
The audit found significant potential energy savings available through the cleaning of dust from fan guards.

Heating and Ventilation.
Heating and ventilation accounts for more than 60% of the total electricity use so the audit focussed on these areas.
It was recommended that the farm consider a trial of heat mats to replace heat lamps and elements. Piglet heat mats are proven to reduce heat loss to the environment. It was recommended that the farm consider conducting a small trial to ensure the performance meets the farms expectations before a larger roll out.
The audit also recommended that the wall heaters be switched off while ventilation fans are in operation.
Maintaining the Solar PV System
The auditor identified some potential issues with the existing 66 kWp Solar PV system: The inverter on site did not appear to be operating and the interval data does not clearly show the impact of solar production. There were also some solar panels covered by some damaged roof sheeting.
It was recommended that the solar provider revisit the site and conduct a full test and assessment of the system.
Shed Lighting
The assessment recommended replacing fluorescent tubes with LED lights.
Table 1. Summary of Recommendations
Recommendation |
Annual Energy Savings (kWh/p.a) |
Annual Costs Savings ($) |
Emission Savings |
Estimated cost to implement |
Payback Period (years) |
Existing solar system monitoring and maintenance |
118,585 |
$25,342 |
86.6 |
$1,000 |
0 |
Optimise ventilation system airflow (Cleaning on fans and guards) |
9,177 |
$2,246 |
6.7 |
0 |
0 |
Piglet heat mats |
79,192 |
$18,327 |
57.8 |
$74,000 |
4 |
Correct Operation of Wall heaters |
18,346 |
$3,576 |
13.4 |
0 |
0 |
Power Factor Correction |
0 |
$2,083 |
0 |
$8000 |
4.3 |
Lighting |
28,980 |
$5,540 |
21.2 |
$16,218 |
3.0 |
Electrical submetering |
13,824 |
$3,285 |
10.1 |
$9,042 |
3.4 |
TOTAL |
268,105 |
$57,461 |
196 |
$108,260 |
2.0 |
Biogas Plant or Solar PV.
The audit compared the costs and benefits of installing an additional 146kW of Solar PV capacity and bioenergy.
Biogas.
The project would involve covering the existing anaerobic pond to capture gas, and combust it in a biogas engine to produce heat and electricity.
A deeper detailed feasibility study would be required to assess the detailed economics of this option.
Based on a plant sized to around 9,000 standard pig units, the auditor estimated a capital cost of around $1,000,000 with annual energy cost savings of almost $200,000, resulting in a payback period of around 5 years. The project would reduce emissions by around 320 tonnes per year.
A detailed feasibility study would need to be conducted to assess:
- true capital costs of the upgrade including retrofitting the anaerobic lagoon and installation of the biogas plant
- the potential to convert electric heating systems to gas to improve utilisation
- reduction in electricity consumption and demand costs, including any limitations around the export of power from the site
- the potential for additional revenue through the sale of Australian Carbon Credit Units.
Large Scale Solar.
A 66kW Solar Photovoltaic system has been installed at the site.
The audit suggested installing a 146 kWp (kilowatt peak) system which would be expected to generate around 202,000 kWh of electricity per annum. The system would be eligible for Large Generation Certificates (LGCs). LGCs are tradeable financial certificates designed to incentivise and reward the generation of renewable energy from large-scale sources, such as commercial solar panel installations.
Note that Solar Systems smaller than 100kW are eligible for Small Scale Technology Certificates (STCs) which are deemed at the time of purchase and reduce the up-front capital cost. The difference between LGCs and STCs is explained at the Clean Energy Regulator website.
The site has a relatively high cost of electricity (18.7 cents / kWh), therefore, a solar system with high on-site utilisation is likely to provide an attractive payback.
Relative costs and Benefits
Although the two projects had very different capital costs and savings, the estimated payback period is similar.
ENERGY MANAGEMENT Opportunity |
Estimated Cost to Implement |
Electricity Savings |
Estimated Opex |
Estimated Electricity Savings |
Total Estimated Savings |
Payback Period |
Period tC02- e |
Install a new 146 kWp Solar Power System |
$233,600 |
202,374 |
-$2,336 |
$48,007 |
$45,671 |
5.1 |
148 |
Biogas plant |
$1,000,000 |
442,384 |
-$100,000 |
$299,194 |
$199,194 |
5.0 |
323 |
Energy Audits
Energy Audits. The farm had a Type 2 energy audit as a participant in the QBEST Ag program. For more information about Choosing Solar Systems, see the Ag Energy Hub Solar Article HERE.
The program was delivered by the Queensland Farmers’ Federation and funded by the Queensland Government.
